To help you stay abreast of market conditions and index strategies for tax-free retirement, here we provide a snapshot of trending indexes, as well as a resource to monitor your individual IUL performance.
How Is Your IUL LASER Fund Performing?
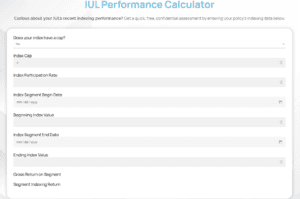 Curious about your policy’s recent performance?
You can check it out by accessing our free IUL Performance Calculator, an online tool we’ve created to help you stay on top of things.
Step 1 – Click here to go to the IUL Performance Calculator.
Step 2 – On the calculator, enter your information, answering simple questions like: Does your index have a cap? What’s your index participation rate? What are your beginning and ending index segment dates?
Step 3 – Get a quick snapshot of your own IUL LASER Fund performance!
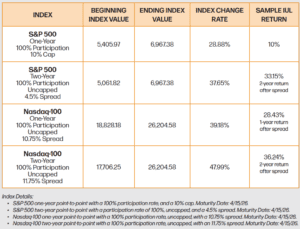
Step 4 – While you’re there, you can also scroll down to see examples of actual recent returns on other available indexes (like the one below)! This can give you an idea of index strategies you might want to discuss with your Certified IUL Professional when your current segments come up for maturity.
*Samples are not guarantees of future performance. IUL Performance Watch provided by LASER Financial.
_____________________________
Watch Aaron Andrew explain these concepts in more detail…
Video Transcription
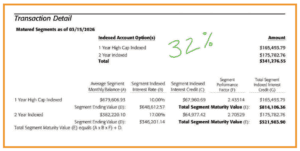
Hello, everybody. This is Aaron Andrew with three-dimensional wealth and our magazine. And what I’m gonna do is talk about the IUL performance watch. As I look to the side, I’m looking at it. You guys can be looking at it on your screen or the hard copy that you have there. But I’m looking at page thirty two talking about the, you know, this quarter’s IUL performance watch. So what I wanna do is just, you know, give you guys a little video on this. It’s talk about, you know, this is my favorite part about IUL is I love the indexing. I love looking at returns. And looking at the first one, the normal S and P account. A lot of companies have at least the normal S and P five hundred with a cap. So what that means is, like, a ten percent cap. Some companies right now are at ten and a quarter, ten and a half. So most around ten to ten and a half on newer policies right now. Some older policies might only have, like, an eight, eight and a half percent cap because interest rates were lower when you bought that policy. But most policies right now on an S and P have around a ten to ten and a half cap. So over one year, you see, the S and P went from fifty four zero five. This is point to point. So what was the market a year ago? K. On that date, what was the market exactly a year later? And this is as of April fifteenth. Okay? So April fifteenth. What was the market on April fifteenth a year ago? What is the market a year later on that exact same date? That’s sixty nine sixty seven you can see. So that growth, if you divide the one number to the other, subtract one, that is twenty eight point eight eight percent. K? Now, of course, you’re gonna get the cap of ten percent. That is a very simple indexing strategy. So you’re not gonna get as much gain on those ones sometimes, but you’re gonna have very consistent returns. Usually, with the last twenty years, you’re usually gonna hit the cap. If the market’s up, the market’s down, you’re gonna get zero as a hero. K? Now, let’s look at the next one, the two year point to point. It’s one of my favorites. So this one has you you would go back two years. So we’re gonna go back two years on April, k, of twenty twenty four that would be. And the S and P was five thousand sixty one and eighty two and point eight two. That was the S and P. The S and P, again, is sixty nine sixty seven two years later, so you you don’t it doesn’t matter what it is in between those dates. It matters what it is on exactly that date, so point to point. The growth is thirty seven percent, point six five. Now, this one has no cap, but it has a spread. So you take four and a half off the top. Now what you need to remember, that’s the equivalent of two and a quarter per year. Two point two five percent per year cause it’s four and a half on a two over the full two years. So thirty seven minus the four and a half, you’re gonna be at thirty three percent. So that’s our two year return. So you didn’t get a return for two years, but you got a thirty three percent return at the end of that two year period tax free with no risk. So if the market had gone down, you get zero. Next one, Nasdaq one hundred is a brand new index, so no clients are really in this one yet. But if you would’ve been in this, because this is with new nationwide policies right now, that one has a uncapped that one has has a bigger spread. Look at the spread on that one. This is the third one down. Ten point seven five spreads. You gotta take a much bigger spread or, you know, money off the top of the return of the index. So with that, it was eighteen thousand eight hundred, twenty six thousand two hundred basically, thirty nine percent growth, huge growth. The Nasdaq one hundred is very volatile. A lot more upside a lot of times than the S and P, but a lot more crash on the downside. That’s the cool thing. You get zero anyways if it’s down. So it went up thirty nine percent. So track ten point seven five off the top, twenty eight point four three percent would be the return that we’d be getting on that one after the spread. Super cool. On that that new account, the Nasdaq uncapped. K. So even though it’s got a bigger spread, and again, it’s because it’s more volatile, it’s more expensive with the options and hedging to do that. K. The next one down. This is our favorite one because looking at the historical returns, it’s really, really cool. So the bottom one, the Nasdaq two year, again, you had to wait two years just like the S and P, the second one, but this one has a bigger spread of eleven point seven five. Now again, that’s the equivalent of about six percent a year. So don’t get too hung up that it’s, you know, a bigger spread than the two year account at four and a half, or even a bigger spread than the one year. It’s better than the one year Nasdaq because, you know, that’s on a one year basis. This is on a two year basis only about six percent per year off the top on that uncapped two year Nasdaq. So that one, you can see, went up forty eight percent, forty seven point nine nine. K. Subtract the eleven point seven five spread. So subtract that off the top, and you’re looking at thirty six percent return over a two year period. Very high. Awesome. Thirty six percent return over two years with no risk. Okay. No, extra cost or fees with those uncapped accounts. Now, again, the spread is not a fee. It’s the way they have to do it to run the strategy with the indexing and hedging. So, yeah, that is an explanation of those. Over on the right side of the of the page, k, on page what page is this? Thirty three, you can scan that code. You could look at your IUL, you know, run the calculator, see what yours would have done, put in your cap, your floor, what is it? But it’s kinda fun to look at the website there. The bottom right hand corner is an actual policy. This is now Pacific Life with multipliers. So this one’s a little bit different. You can see that the one year high cap there had six hundred and seventy nine thousand dollars just on this month, k, on that month. And over one year, you hit the cap of ten percent in this one. But because we have a multiplier, this is a little more complex. This one, you you’re paying an extra seven and a half percent fee to get an extra two point four three multiplier or they call it a performance factor. So see column f or that multiplier. So instead of getting ten percent, we’re actually getting twenty four percent. But you have to subtract seven and a half off the top. So you’re really getting about sixteen or just about that on that one. The two year account, this is a different two year. This two year has a seventeen percent cap, and it doesn’t have a spread. It has a cap like the one year. That one, you got seventeen percent because it hit the cap, but you got an extra two point seven multiplier. So let me do that in my calculator real quick here. Seventeen times two point seven. You have forty five point six. K? Now forty five point six percent return on that one. Now technically, we paid seven and a half percent fee for two years. So technically on that one let’s see here. Third let’s see. I gotta do that again. Just messed it up on my calculator. Twenty two point seven times seventeen. Forty five point six minus the fifteen percent. You’re getting really on that one, a net of thirty point nine. But, yeah, you are gonna get a true forty five point nine percent return because you already have paid the fee over the last year. So anyone that has a Pacific Life policy, you know they’ve got multipliers where you can pay more to get more upside. Pretty cool. The downside is in the bad years, you go down by an extra seven and a half percent. But every company’s got a little nuance of cool things, cool strategies, multipliers, no multipliers, the uncapped, you know, two year S and P and two year Nasdaq you saw on the other side. But that gives you guys a take taste of me just kinda talking through it. But make sure you call us up, see what we could do for you on an IUL if you need one or on yours to see what your returns were and how it kinda compares to these ones because every IUL is a little different. Thank you for watching.
Click here to see magazine pg. 32 – 33 that Aaron is referencing.
_____________________________

Ready to open a new or additional IUL LASER Fund policy? Click here to connect with a Certified IUL Professional today.
Want to go deeper on index strategies? Check out the Spring 2026 “Index Insights” article.